Ad creative testing: what works and what doesn't


You ran five creatives, watched the CPA column for two days, killed the worst three, and scaled the one Ads Manager crowned. Then the winner faded and the next batch taught you nothing. You weren't sloppy — you followed instructions that don't work at your budget. Ad creative testing on Meta rests on a comparison the platform can't give you: it never shows two creatives to the same people, and at $20 a day the numbers can't separate signal from noise anyway.
The framework below is what the evidence supports: the two walls the guides skip, the rules to drop (including one we published here), and how to decide without significance.
What ad creative testing actually is — and what a Meta test can't tell you
Ad creative testing is the practice of running two or more ad creatives on the same platform at the same time, under matched campaign settings, then using the reported results to decide which creative keeps getting money. Performance marketers run it in a live ad account, on real spend. Market researchers use the same words for ad pre-testing, where a panel rates a rough cut before media is bought — the Kantar and Qualtrics sense. Everything below is the first kind.
A Meta A/B test measures something real: the ad-plus-algorithm bundle — this creative, delivered the way Meta chooses, to the users Meta picks. Braun and Schwartz, authors of the sharpest critique of platform A/B testing, still tell advertisers to use the tools for that job — "for the experimenters whose goal is to predict which ad creatives will 'perform best' in a targeted environment… our advice is: Carry on using available A-B testing tools" (Journal of Marketing 89(2):71–95, 2025). Forecasting the bundle is useful, because the bundle is what you buy. Exporting the answer as a fact about your creative is not — and that distinction reorganizes everything below, including why creative is the only lever left.
Wall one — Meta never shows two creatives to the same people
What divergent delivery is
Two ads, identical targeting, identical budgets. Meta scores each ad's content for relevance to each user, so Meta routes each to the people it expects that ad to do best with — continuously, invisibly, during the test. Braun and Schwartz named the pattern divergent delivery, "an inevitable consequence of targeting ads to users based (in part) on relevance." Their verdict: it "makes causal inference about the effect of ad content impossible because the comparison in outcomes between ads is not 'apples to apples'."
Their field experiment served 533,161 impressions to 96,150 users with no gender or interest targeting. Even the two control public-service ads drifted apart on gender, 57.0% versus 50.8% female — divergence inside the experiment, not after it.
The image is the lever
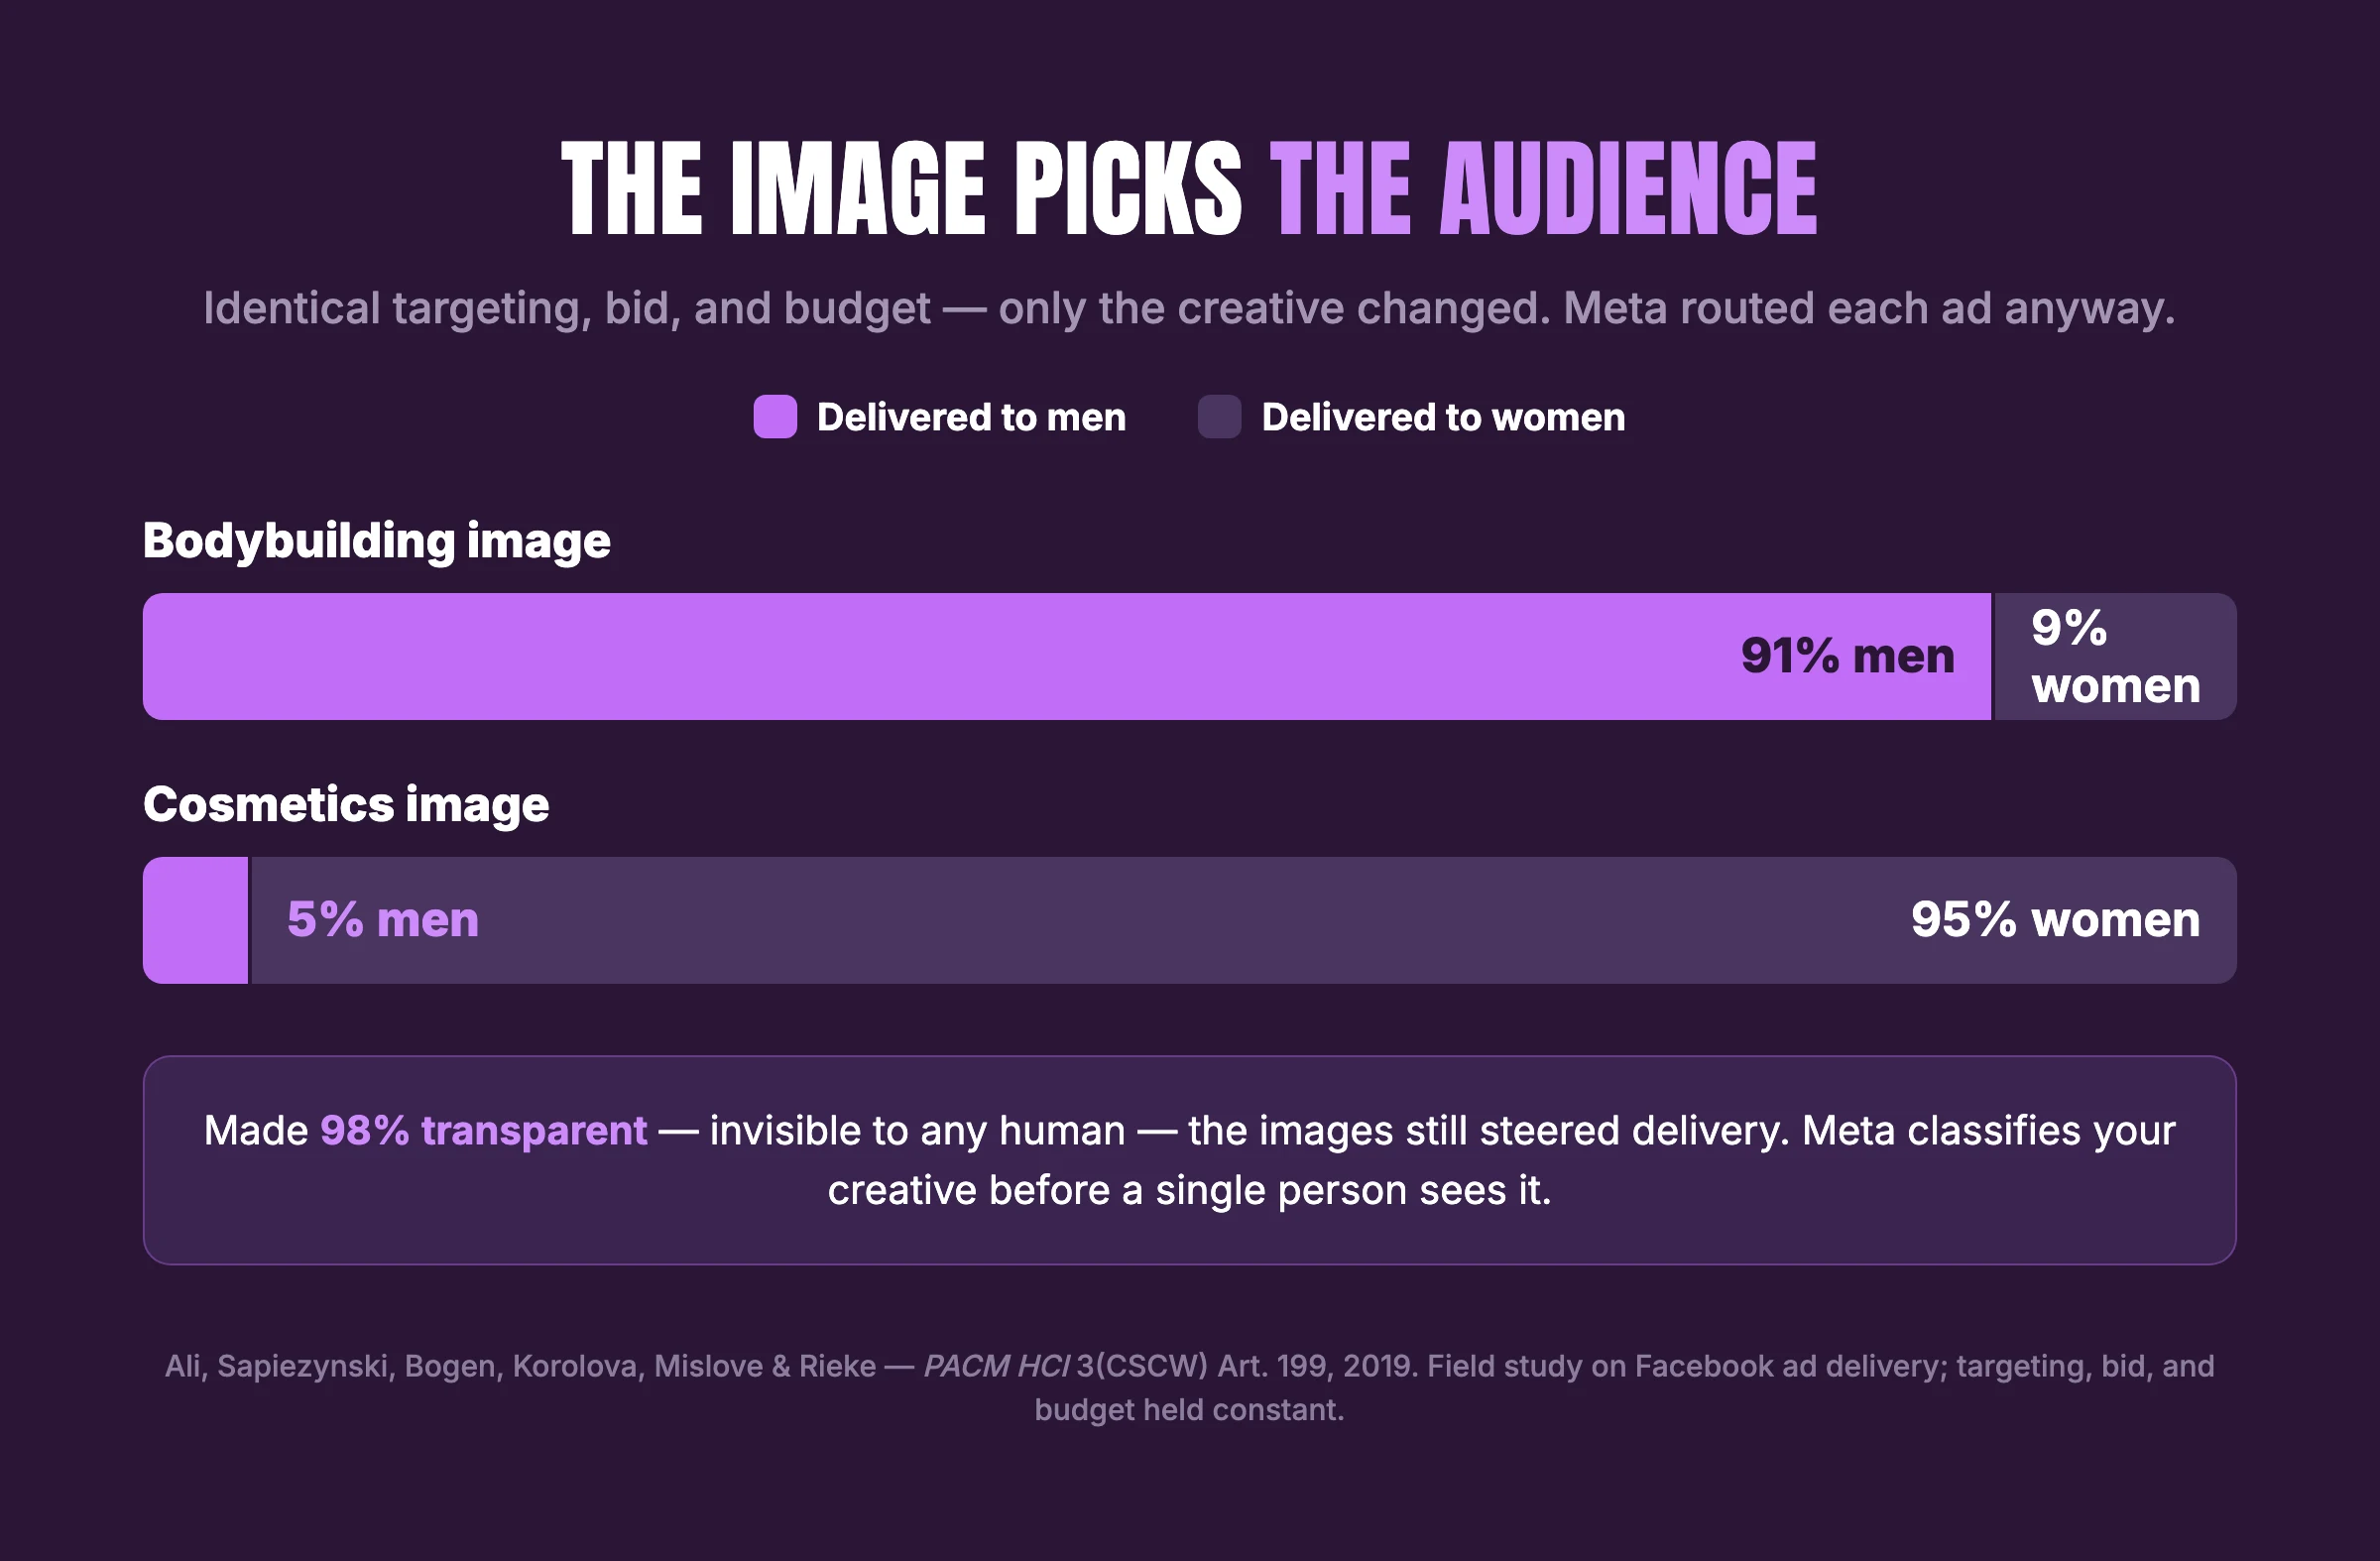
Ali and colleagues held targeting, bid, and budget constant, changing only the image: a bodybuilding ad went to 91% men, a cosmetics ad to 5% (PACM HCI 3(CSCW) Art. 199, 2019). Text and headlines barely moved delivery; the image moved it hugely. Then the detail that settles it: they made the images over 98% transparent, invisible to any human, and delivery still diverged significantly. Meta classifies your creative before a single person sees it.
Three defenses that don't work
Holdouts don't fix it — "when targeted users are unbalanced across ads, splitting those users into treatment and holdout arms is no help" (Braun & Schwartz). Platforms won't switch it off; it's profitable, and Braun and Schwartz relay an insider's estimate of "two to three years of engineering work" to disable it. Demographic breakdowns prove nothing either: balanced ages and genders leave users "unbalanced on the more important latent, unobserved characteristics."
Three tests out of 181,890
Meta's research scientists measured it at scale. Burtch, Moakler, Gordon, Zhang, and Hill examined 3,204 Lift tests and 181,890 A/B tests (preprint, 2025-08-28 — not peer-reviewed, three co-authors are Meta employees). Lift tests showed no meaningful imbalance. A/B tests showed clear imbalance, worst for conversion objectives, where 32% of p-values fell below 0.05. After filtering for every configuration that reduces it, the clean sample was three tests.
Their dissent belongs here: divergent delivery, they argue, "is intentional. It reflects real-world delivery under business-as-usual deployment." Both camps agree it can't be eliminated. Their recipe, for anyone still running tests: "this requires setting identical (reach) objectives, budgets, bid strategies, schedules, targeted audiences, and manual ad placements across test cells, varying only the ad creative itself."
Wall two — a real budget is underpowered by one to two orders of magnitude
The identical-ad-sets test
Jon Loomer ran three identical ad sets, spending over $1,300 across roughly 266 conversions. Ad set B took 100 conversions at $4.45; ad set A took 80 at $5.56 — a 25% spread between identical ad sets (2024-09-30). Meta's tool put B's chance of winning at 59% and called A "a clear loser at 14%." One test, three arms: it illustrates randomness rather than sizing it. His conclusion is the one to keep — "that's not paralyzing. It's freeing."
Meta hands you a winner at 65% confidence
Ads Manager crowns a winner at 65%: "for A/B tests, a 65 percent or higher confidence percentage represents a winning result" (Meta Business Help, retrieved 2026-07-30). Roughly a one-in-three chance of not replicating, delivered as a trophy.
Watching the dashboard makes it worse
Continuous monitoring inflates false positives. Johari, Pekelis, and Walsh showed that "even with 10,000 samples… Type I error can easily increase fivefold" (arXiv preprint, 2015; published as Operations Research 70(3), 2022 — the fivefold line is the preprint's). Their illustration is an A/A test where both arms are identical and the dashboard names a click-through-rate winner anyway. Ads Manager is that dashboard, uncorrected.
How far below the line: detecting a 5% effect in a two-cell Facebook lift test needs about 10,754 control conversions (Liu, Bettaney & Chamberlain, AdKDD '18 — lift-test power math with holdouts, not Ads Manager), while the average conversion-optimized Meta A/B test carries around 23,000 impressions. Short by more than an order of magnitude. Lewis and Rao put the median ad experiment at roughly 60 times too small to resolve a 10% return gap (Lewis & Rao, QJE 2015 — display, ad-versus-no-ad; the power argument transfers, the design doesn't).
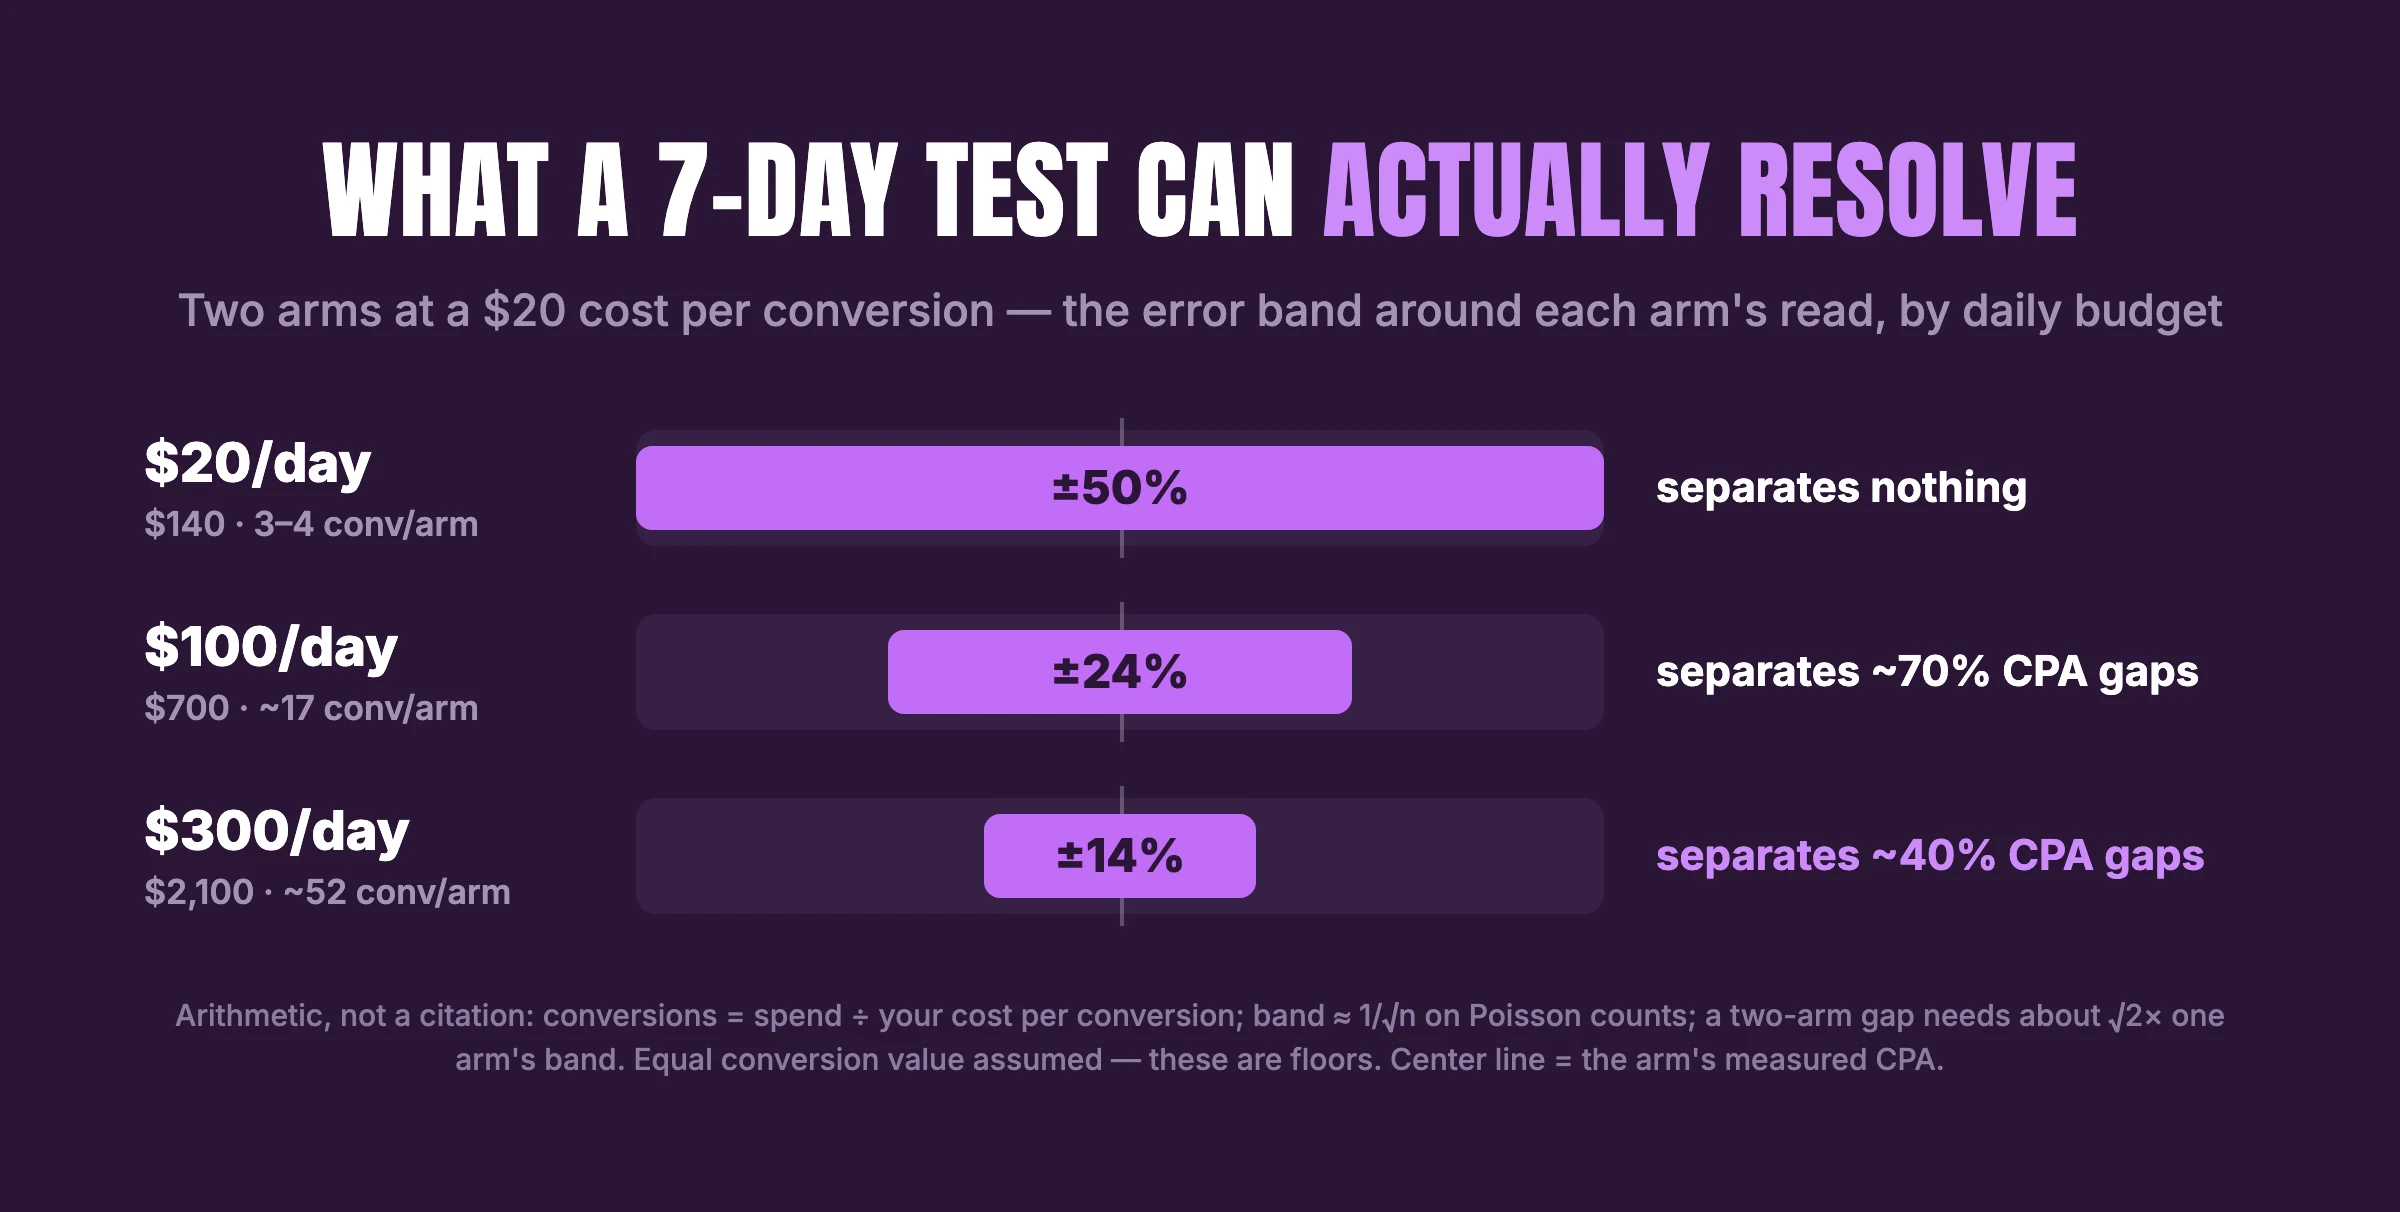
| 7-day test, two arms | Conversions at a $20 cost per conversion | Error band on one arm | Smallest CPA gap it separates |
|---|---|---|---|
| $20/day → $140 | ~7 total, 3–4 per arm | ±50% | none |
| $100/day → $700 | ~35 total, ~17 per arm | ±24% | roughly 70% |
| $300/day → $2,100 | ~105 total, ~52 per arm | ±14% | roughly 40% |
Arithmetic, not a citation: conversions = spend ÷ your own cost per conversion, error band 1/√n on Poisson counts, two-arm gaps about √2 times one arm's. Equal conversion value assumed, so these are floors. Below 0.5 power, significant estimates are inflated; below 0.1 they flip sign (Gelman & Carlin, 2014). And when breakthroughs are one in 500, a significant winner has a 3.1% chance of being true (Kohavi et al., KDD '14).
The numbers everyone repeats that don't hold up
Eight claims run through nearly every guide in this SERP. Each row names what the number really is — including one of our own.
| Claim | Status | What's actually true | Source |
|---|---|---|---|
| "50 conversions is the significance threshold" | folklore | A delivery-stability number: ad sets exit the learning phase "after about 50 results." | Meta Help, retrieved 2026-07-30 |
| "Meta recommends $100/day per variation" | not Meta guidance | Meta publishes no minimum test budget. Its whole guidance: a budget "that will produce enough results to confidently determine a winning strategy." | Meta Help, retrieved 2026-07-30 |
| "Meta recommends 6 or fewer ads per ad set" | withdrawn | Gone from that page. Now: "too many ads can result in worse performance" and "decrease ads per ad set, but maintain diverse creative assets." | Meta Help, retrieved 2026-07-30; removal spotted by Jon Loomer, 2025-07-08 |
| "Creative fatigue sets in at 3–7 days" | misattributed | That article gives Facebook and Instagram 1–2 weeks; 3–5 days is its TikTok row, and presents no data. | Search Engine Land, 2025-10-24 |
| "Creative drives 56% of outcomes" | degraded in relay | NCSolutions measured creative's digital-only contribution to incremental sales; relayed twice, it became "all outcomes." | Vidmob, 2023-06-28; NCSolutions, 2023-08-10 — both sell creative measurement/analytics |
| "Andromeda means upload more creatives" | unsupported | Andromeda is retrieval, upstream of the auction. Meta's post never says "upload" or "more creative." | Meta Engineering, 2024-12-02 |
| "Your ad sets bid against each other" | contradicted | Meta: "this ensures that your ads will not bid against one another." The real harm is de-duplication, which "prevents ads from entering auctions." | Meta Help, retrieved 2026-07-30 |
| "10–15% of creatives become winners" | ours, and too high | Roughly 4–8% by spend tier across 578,750 creatives, ~4% under $10K/mo. Meta publishes none. | Motion Creative Benchmarks 2026 — Motion sells creative analytics |
That last row was ours: this post claimed 10–15% and credited it partly to "Meta's own reporting." The real rate is 4–8% by account size, and Meta has never published one. Corrected win rates by spend tier.
What works: judging creatives without significance
Produce genuinely distinct concepts, not variations of one
The line comes from Meta itself: "creative iteration might produce two ads with identical visuals, but different text CTAs, while creative diversification would generate two distinctly different pieces of creative" (Meta, 2025-12-16). Recolors are iteration. New layouts, angles, and use cases are diversification. Meta publishes no number for how many concepts to run, so every count below is arithmetic or a practitioner's.
Judge on cheap, large-effect signals first
Small budgets resolve only big differences, so hunt for them in upper-funnel numbers before conversions accumulate. No source at any tier publishes a rigorous ad-level CTR-to-ROAS correlation on Meta, in either direction. Kohavi documented the reversal: a variant that cut clicks 64% was the better ad, because its price tag pre-qualified those clicks (KDD '14). Meta says the same about its own diagnostics — "achieving high ad relevance diagnostics rankings should not be your primary goal" (Meta Help, retrieved 2026-07-30) — which is why Motion scores the largest public Meta creative dataset on realized spend, "not CTR, CPA, or ROAS."
Kill on economics, not confidence
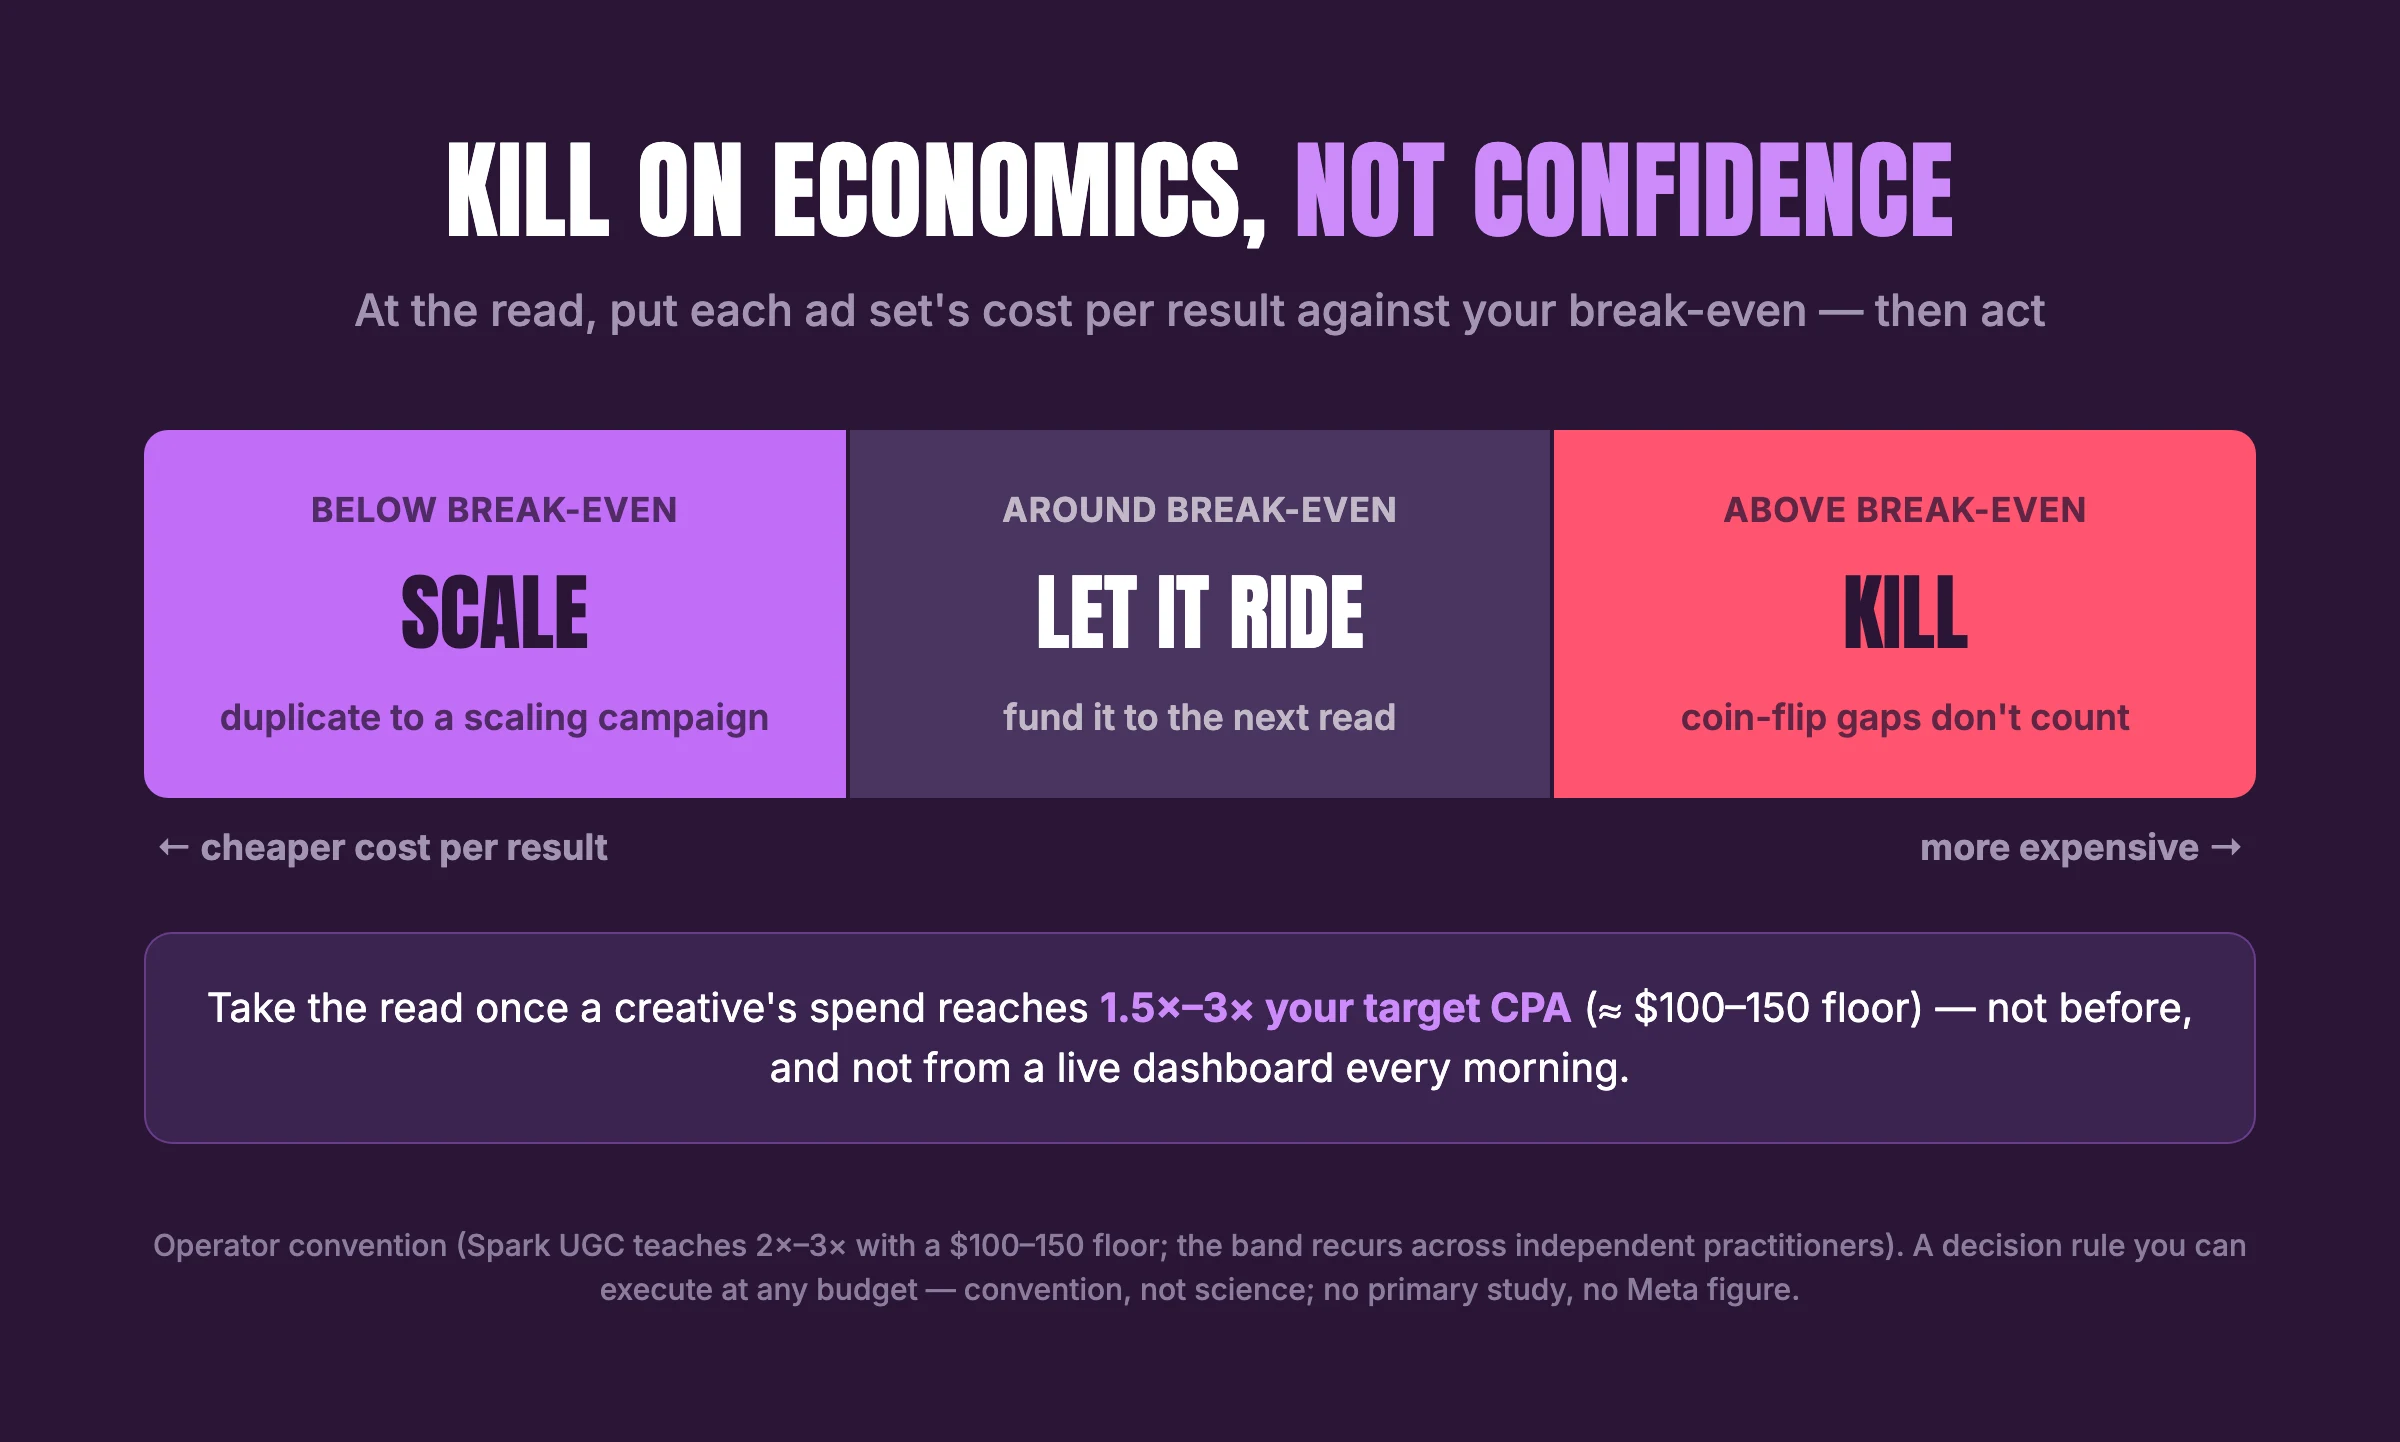
The operator convention: read a creative once its cost per result sits between 1.5× and 3× of target CPA — Spark UGC teaches 2×–3× with a $100–150 floor, and the band recurs across independent practitioners. At the threshold, put the ad set's cost per result against your break-even: kill what sits above it, keep funding what sits below, and let everything in between ride to the next read. The band is convention, not science — no primary study behind it, no Meta figure to argue with — but it's a decision rule you can execute at any budget.
Read at the ad-set level, and expect unequal spend
On this, Meta is explicit — "when running multiple ads in 1 ad set, evaluate your results at the ad set level" (Meta Help, retrieved 2026-07-30). Unequal spend is the design: "each of your ads won't necessarily be delivered the same number of times," and delivery follows "predictions of future performance… not each ad set's past performance" (Meta Help, retrieved 2026-07-30).
The metrics that decide kill or scale
Cost per result is spend divided by your optimization event. CPA is spend per sale. Hook rate isn't a Meta metric — Meta reports "3-second video plays," and one ad's hook rate is an impression-weighted average across placements with different autoplay behavior, so it moves on placement mix alone. That compounds with divergent delivery. Hook rate, hold rate and CPA defined has the arithmetic.
Two worked examples come from Meta itself. Instagram Stories ran a $1.46 CPA on $450 while Facebook Stories ran $1.10 on $50 (retrieved 2026-07-30) — the cheaper placement got nine times less budget. And switching off the worst-reported-CPA ad set takes Meta's own example from 12 conversions at $2.50 to 11 at $2.73 (retrieved 2026-07-30). Part of that number isn't observed: Meta models "the likelihood a conversion occurred… from a lower level breakdown—campaign, ad set, or ad level" (Meta Help, retrieved 2026-07-30).
| Decision | Signal | Threshold | Status |
|---|---|---|---|
| Read a creative at all | accumulated spend | 1.5×–3× target CPA | convention; no study, no Meta figure |
| Keep spending | ad-set cost per result | your break-even | sourced: Meta says read at ad-set level |
| Kill on reported CPA alone | — | don't | sourced against: Meta's own example |
| Refresh on a calendar | — | no cadence exists | unmeasured at every tier |
When it works: scale without resetting what taught you it works
Duplicate the winner at a higher budget, or raise its budget gradually. Never edit the original: "any change to ad creative" and "adding a new ad to your ad set" both sit on Meta's list of significant edits that reset the learning phase (Meta Help, retrieved 2026-07-30), and learning-phase results "aren't necessarily indicative of future performance." The winner runs untouched while fresh variants queue as the next batch. Advantage+ campaign setup covers the scaling structure.
Write down what you learned, or you'll test it again
Nobody picks winners from craft: professionals called the winner in a pair 52% of the time against a coin flip (Marpipe, 2022-03-07 — win definition undisclosed, sells testing software). A record of what you've burned is the only asset that compounds.
| Practice | Why it works | Source |
|---|---|---|
| Launch distinct concepts, not variants | Meta's own iteration-vs-diversification line | Meta, 2025-12-16 |
| Hunt large differences only | small budgets can't resolve small gaps | Kohavi et al., KDD '14 |
| Kill on economics, not confidence | significance is out of reach entirely | Liu et al. 2018 vs Burtch et al. 2025 |
| Read at the ad-set level | Meta allocates unequally and models the rest | Meta Help |
| Keep a written record | winners aren't predictable, so only records compound | Marpipe 2022 (sells testing) |

Create your own product product ads
Create your ad
How many creatives, and how long to run each
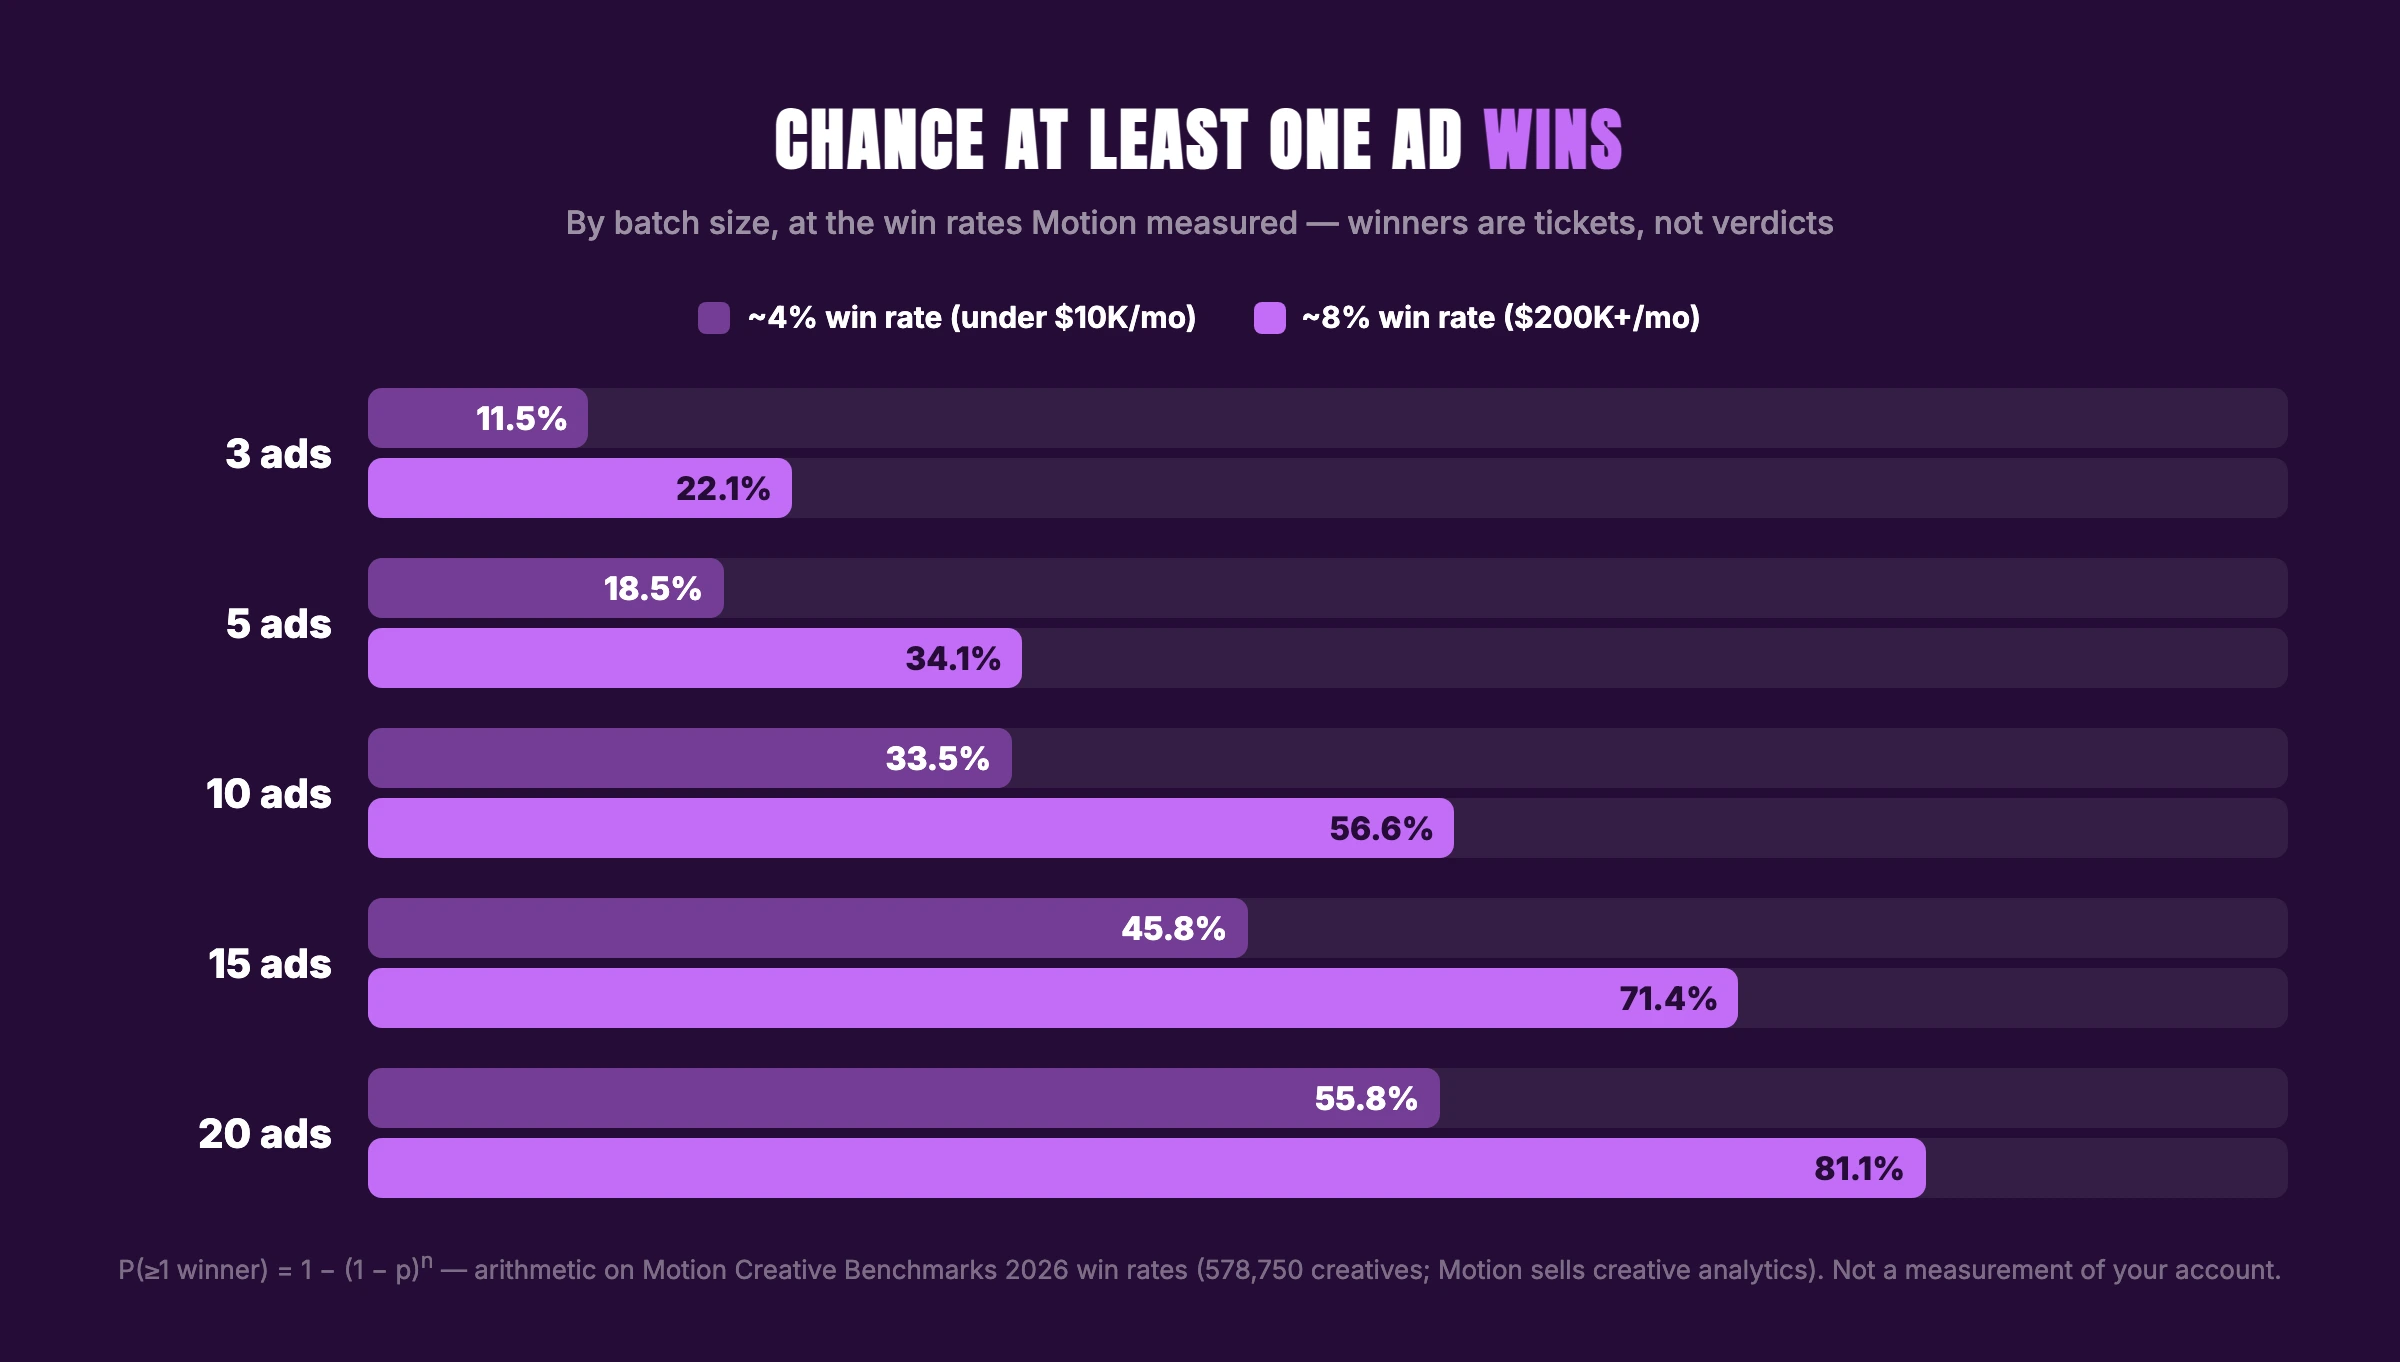
Winners are rare and unpredictable, which makes this portfolio logic rather than hypothesis testing. You aren't buying certainty about one ad — you're buying more tickets. Depth lives in how many ad creatives to test — briefly: batch size scales with what your budget funds past the delivery floor, and duration starts at 7 days.
| Spend tier | Win rate | Winners per month | Roughly |
|---|---|---|---|
| Micro, under $10K/mo | ~4% | 0.0 under Motion's ≥$500 floor | 1 in 25 |
| Small, $10–50K/mo | 6.2–6.4% | rises with volume | 1 in 16 |
| Medium | 7.3–8.1% | rises with volume | 1 in 13 |
| Large and enterprise | 8.1–8.6% / 8.2–8.8% | highest | 1 in 12 |
All four rows come from Motion's 2026 benchmarks — 578,750 creatives, 6,015 accounts, $1.29B spend, launched 2025-09-01 to 2026-01-01. Motion sells creative analytics, its charts disagree on the micro figure (3.7% versus 4.0%), and it forbids the causal read: "do not claim that 'testing more creatives per week causes more winners' in a causal sense." A winner means taking 10× the account's median single-ad spend and at least $500. That floor is why the micro tier records zero — a definitional artifact, not a finding about small advertisers.
Roughly half of all Meta creatives (49.3–53.9%) get switched off before 28 days, in every tier. Concentration is extreme nearby: the top 2% of gaming creatives took 53% of spend across 1.1M variations (AppsFlyer, which sells attribution and creative analytics — app installs, not DTC). No peer-reviewed source produces a creative hit rate; every number in circulation, ours included, is vendor data.
Testing methods, and when each one is worth it
Meta's A/B Test tool — the documented way
Ads Manager's built-in test does what a manual rig can't: "we show each version to a segment of your audience and ensure nobody sees both" (Meta Help, retrieved 2026-07-30). Guidance is a 7-day minimum, 30-day maximum, shorter tests called inconclusive — while the same product lets you schedule a single day. Meta concedes false winners too: "there weren't enough results to calculate an accurate winner" (Meta Help, retrieved 2026-07-30). Layer the Burtch configuration over it: identical (reach) objectives, budgets, bid strategies, schedules, targeted audiences, and manual placements, varying only the creative.
Meta creative testing: the native tool, shipped September 2025
Meta documents it at Set up a creative test in Meta Ads Manager (retrieved 2026-07-31): the test runs inside an existing campaign "so that high performing ads can continue to run after the test with delivery system learnings retained," creates 2 to 5 copies of an ad whose creative you then swap, takes a suggested "no more than 20%" of the existing budget, doesn't support bid-cap strategies — and "a confidence level is not included." It changes nothing by itself: results identify top performers, and the test ads keep running until you act. Per Jon Loomer's field write-up (2025-10-13), spend is equalized across test ads, built to "prevent Meta from optimizing delivery to specific ads." Then on 2026-01-01, reader reports that Meta "isn't distributing budget evenly during the test" — unresolved.
Dynamic creative and flexible format — no stable answer right now
Meta restricted dynamic creative in Ads Manager for sales and app-promotion objectives from June 2024, hedged as "you may no longer be able to," and pointed advertisers at flexible format — which now carries its own notice: "starting in March 2026, the flexible format will no longer be available in Ad setup" (Meta Help, retrieved 2026-07-30). Both remain live in the Marketing API, docs updated 2026-05-21 and 2026-06-16, no deprecation banners. Confirming either removal needs a logged-in Ads Manager session, so treat outcomes as unverified.
What not to do: one creative per ad set, and manual on/off
Earlier versions of this post prescribed one creative per ad set, each on its own budget (ABO), plus killing losers by hand at 48 hours. Meta's documentation contradicts that three ways. De-duplication "prevents ads from entering auctions" and "can prevent an ad set from spending its full budget or achieving enough results to exit the learning phase" (Meta Help, retrieved 2026-07-30), so isolating creatives maximizes the starvation it was meant to avoid. Meta also says, "we do not recommend testing informally, such as by turning ad sets or campaigns on and off manually. This can lead to inefficient ad delivery and unreliable test results" (Meta Help, retrieved 2026-07-30). And splitting creatives across ad sets never randomized exposure, so divergent delivery survives untouched. Format choice is separate: static versus video.
Ad creative testing on a real budget
The frameworks that dominate this search result assume a data warehouse or an enterprise platform. What the arithmetic above permits at three real budgets:
| Daily budget | Concepts per batch | What it can read | What it can't | How to decide |
|---|---|---|---|---|
| Under $30 | 2–3 | whether each ad delivers; blowout gaps | any CPA comparison | 7 days, kill on break-even, ignore confidence numbers |
| $30–$150 | 3–5 | one-sided gaps around 70% | 10–20% differences | 7-day minimum, ad-set-level read, next batch in parallel |
| Above $150 | 5 or more | gaps around 40%, cautiously | small differences | Meta's A/B Test tool, matched settings, no peeking |
Concept counts are our arithmetic from the error bands above, not a platform recommendation.
Don't plan any of it off a published CPM benchmark. In Q4 2025, Meta CPM fell 13% in aggregate while 44% of advertisers saw CPM rise year over year (Tinuiti, over $4B under management, reporting its own client book). Meta's blended price per ad rose 12% in Q2 2026. Dispersion is the point: your own CPM is the only input worth budgeting against. Verticals differ too — mobile game creative testing runs on install economics.
Creative fatigue: what's measured, and what isn't
Start with Meta's own numbers, unblended. At four repeated exposures, the associated likelihood of a conversion drops about 45%. Over 19% of impressions are the sixth or later view in a 30-day lookback. Mean exposures per user per creative: 4.2. Decay tracks (N+1)^-0.43. Across roughly 26,000 cases, fresh creative improved conversion rate by about 8% in high-fatigue cases (Analytics at Meta, 2023-05-10). Sample size isn't stated, so read 45% as association, not causation.
Nobody has published a refresh cadence — not Meta, not academia, not the holder of the largest creative dataset. Motion publishes nothing on fatigue timing and gets miscited for it anyway. Any "replace your creative every N days" rule was invented.
And the best causal evidence says fatigue isn't universal. Randall Lewis, examining 2.8 billion impressions across 30 natural experiments with exogenous frequency variation ("Worn-Out or Just Getting Started?", AEA 2015 — Yahoo display, 2010, not Meta), found four campaigns wearing out fast while ten showed near-constant returns past 20 impressions. His sharper finding: observational data "overstates wear-out for 26 of the 30 campaigns" — and the fatigue charts in circulation are observational.
Meta's operational definition isn't a frequency or a day count. It's a cost multiple: cost per result above past ads but under double shows a Creative limited status; double or more, Creative fatigue (Meta Help, retrieved 2026-07-30). Only for ad sets running one creative. Keep it apart from brand-recall frequency research, which measures a different outcome.
Creative testing platforms, and what they can't buy you
Three different products call themselves creative testing tools. Analytics tools tell you what happened to creatives you already made, grouping them so patterns show up — useful once you produce enough for patterns to exist. Testing tools try to equalize delivery so a comparison means something, the job Meta's own Creative Testing tool attempts. Generation tools make the creatives.
At $20 a day, the constraint is almost never analysis. You lack the conversions for an analytics layer to find signal in, and no tooling buys statistical power. Allocation is already automated, and that's the part you don't control — the honest answer to "can creative testing be automated."
The real bottleneck is production, not analysis
Winners run near 4% at this budget tier. Nobody predicts them from craft — practitioner picks land at 52%, barely above chance. So winners get found by drawing more tickets, which makes production rate the ceiling.
The documented direction of travel at Meta has the same shape: "decrease ads per ad set, but maintain diverse creative assets per ad set. One ad can contain multiple (up to 10) creative assets" (retrieved 2026-07-30). Fewer ad objects, more variety inside them — what a batch of cloned layouts produces.
Market rates: one custom static Meta ad runs $15–$30 on Fiverr, specialist batches at a flat $30 per asset (prices we observed 2026-07-30, four gigs, purposive not distributional). UGC costs more — average creator payout $154, average campaign cost $197 across 21,000+ collaborations (Collabstr 2026 — a creator marketplace reporting the payouts it brokers).
AdDogs exists for that step. Pick a reference from 14,000+ ad examples or upload one, add your product photo, and it rebuilds the layout with your product in it in seconds — brand colors and logo extracted automatically. 1 credit = 1 ad in the selected dimension, and Pro and Ultimate unlock all 14 aspect-ratio options. Make the variations, or read how to recreate a winning static ad.
What it doesn't do: run your tests, measure results, make video, or fix a bad offer. And "clone what works" is a response to divergent delivery rather than a proven edge — since Meta classifies your creative and routes the audience from it, starting from a layout the algorithm already distributes is a different bet than a blank canvas. Nobody has measured that gap, us included.
A two-week testing loop you can actually run
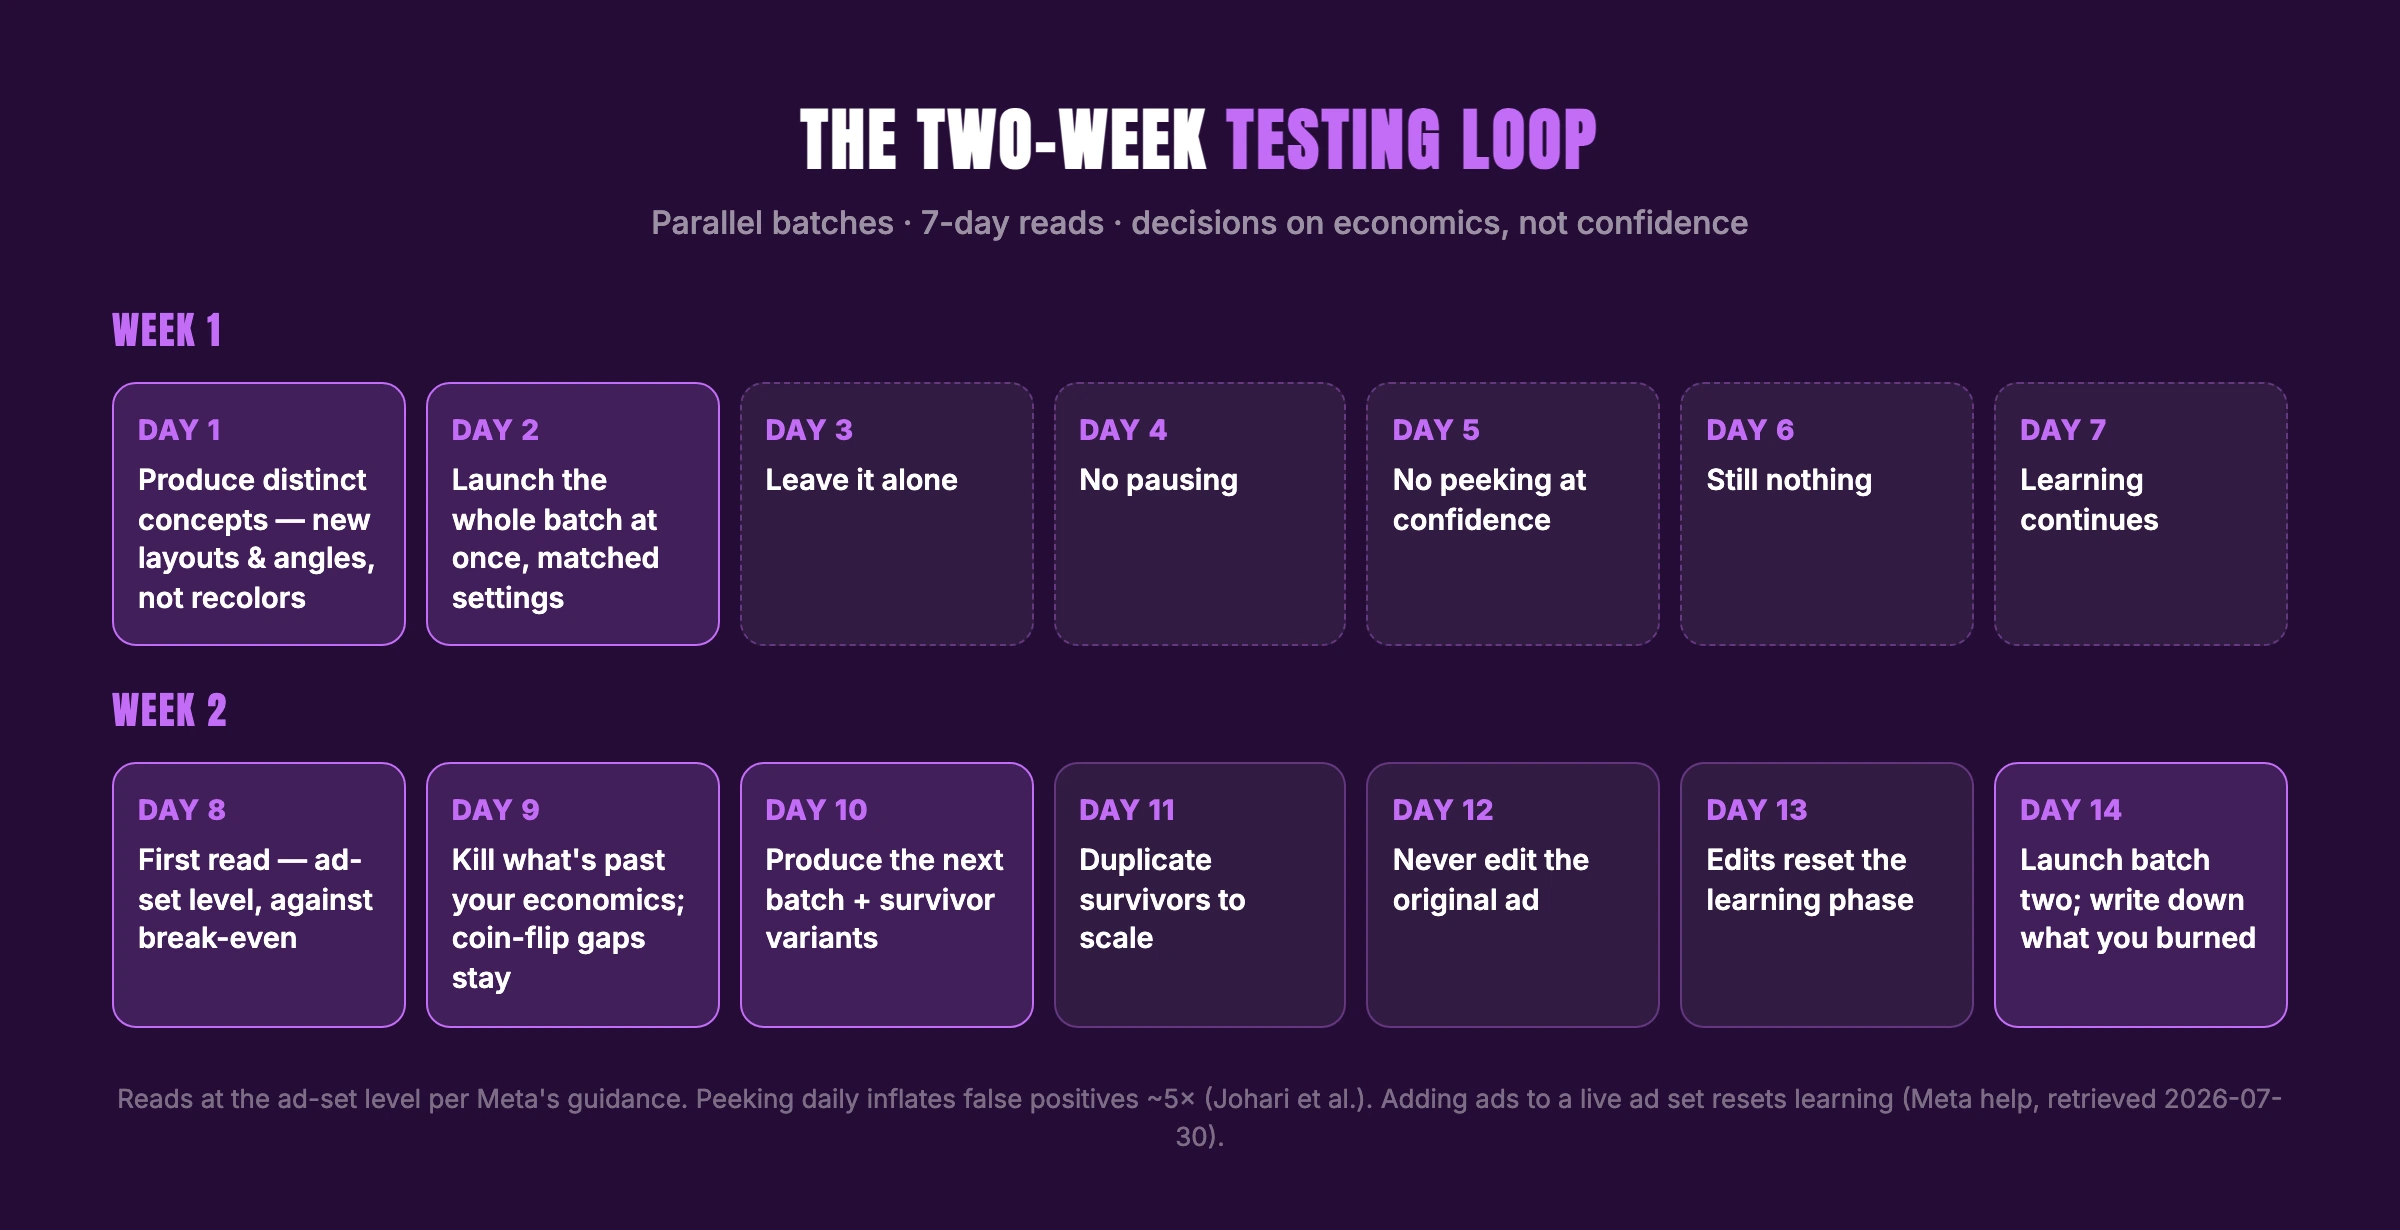
We used to call this cycle clone, test, kill, scale — on a 48-hour read, one creative per ad set. The version the evidence supports runs on parallel batches, 7-day reads, and decisions on economics.
| Day | Action | Why |
|---|---|---|
| 1 | Produce a batch of distinct concepts — new layouts and angles, not recolors | diversification, not iteration |
| 2 | Launch the batch at once, matched budgets and placements, nothing added later | injection resets learning |
| 3–7 | Leave it alone — no pausing, no peeking at the confidence column | peeking inflates false positives ~5× |
| 8 | First read, at ad-set level, against your break-even | Meta reads at ad-set level |
| 9 | Kill only what's past your economics; coin-flip gaps stay | 25% spread between identical ad sets |
| 10 | Produce the next batch: fresh concepts plus survivor variants | production is the ceiling |
| 11–13 | Duplicate survivors into higher budget; never edit the original ad | creative edits reset learning |
| 14 | Launch batch two in parallel; write down what you burned | only records compound |
FAQ
What is ad creative testing?
Ad creative testing means putting two or more creatives live at once with every other campaign setting matched, then letting the reported results decide which one keeps its budget. It runs on real spend, unlike market-research ad pre-testing, where a panel rates creative before any media is bought.
Can Meta tell you which creative is better?
Not on its own. Meta never shows two creatives to the same people, so a result mixes the creative with the audience Meta picked — making "causal inference about the effect of ad content" impossible (Journal of Marketing 2025). A test forecasts the bundle, not the creative.
How do you test ads on Facebook?
Facebook ad testing runs through Meta's A/B Test tool, which shows each version to separate segments and ensures nobody sees both. Match objectives, budgets, bid strategies, schedules, audiences, and placements, varying only the creative. Run 7 days minimum, read at ad-set level.
How long should each creative run before you decide?
Meta's floor for its own A/B tests is 7 days, and it calls shorter tests inconclusive. Practitioners wait until spend hits 1.5× to 3× target CPA — convention, not science. Below that, an apparent gap is usually randomness.
How long before creative fatigue sets in?
No source publishes a cadence — not Meta, not academia, not the holder of the largest creative dataset. Fatigue, in Meta's own dashboard, is a cost multiple: cost per result above past ads is "Creative limited," double or more "Creative fatigue," single-creative ad sets only.
How many ad creatives should you test?
Enough for roughly 1-in-25 odds to work for you, since win rates sit near 4% under $10K/mo and 8% at the top (Motion, 578,750 creatives). Your budget bounds batch size — how many ad creatives to test has the arithmetic.
What is Meta's Creative Testing tool, and should you use it?
A native tool shipped September 2025 that runs inside an existing campaign, copying an ad 2 to 5 times with equalized spend to "prevent Meta from optimizing delivery to specific ads." No confidence level is included, by Meta's own documentation. Practitioners reported uneven spend in January 2026 — check yours.
Do you need a creative testing platform?
At small budgets, no. Analytics platforms find patterns across creatives you already made, which needs volume you don't have yet, and no tool buys statistical power. At $20 a day the constraint is producing enough distinct concepts.