Ad metrics glossary: CPM, CPC, CTR, ROAS, CPA, CPI, AOV & LTV in plain English

You opened Ads Manager for the first time, and it's a wall of acronyms — CPM, CPC, CTR, ROAS — stacked in columns you can't read yet. Here's your decoder: what each metric means, the formula behind it, a real dollar example, and what counts as "good" in 2026.
Eight metrics is all a beginner needs to read an ad account. Three apply to everyone — CPM, CPC, and CTR — while the rest depend on what you sell: e-commerce lives on ROAS, AOV, and CPA; apps live on CPI; and LTV matters to both. This page covers both paths — read straight through, or skip to whichever metric you need.
What each ad metric means (at a glance)
| Metric | Stands for | Formula | What it measures | What "good" looks like in 2026 |
|---|---|---|---|---|
| CPM | Cost per mille (per 1,000 impressions) | (spend ÷ impressions) × 1,000 | The price of putting your ad in front of 1,000 people | Varies by niche — ~$11 (apparel) to ~$19 (health/wellness); auction-driven, treat as directional |
| CPC | Cost per click | spend ÷ clicks | What you pay for one click | Google Search avg ~$2.69; Shopping ~$0.66 (directional) |
| CTR | Click-through rate | (clicks ÷ impressions) × 100 | The share of viewers who clicked | Paid-channel median ~1.77%; higher on high-intent Search |
| ROAS | Return on ad spend | revenue ÷ ad spend | Revenue earned per $1 of ad spend | Above your break-even ROAS (1 ÷ gross margin) |
| AOV | Average order value | revenue ÷ orders | The average dollars per order | Median paid order ~$74; Shopify cites a global avg ~$145 |
| CPA | Cost per acquisition | spend ÷ conversions | What one sale, lead, or signup costs | Meta e-commerce ~$38.19; Google search ~$45.27 |
| CPI | Cost per install (apps) | spend ÷ installs | What one app install costs | Android ~$1.20 / iOS ~$3.60 |
| LTV | Lifetime value | AOV × purchase frequency × lifespan × gross margin | Total profit one customer is worth | LTV:CAC of at least 3:1 |
Don't worry if the formulas look dense — each one is unpacked below in plain English.
CPM — Cost per mille (cost per 1,000 impressions)
CPM is what it costs to show your ad to 1,000 people — the price of attention, before anyone clicks anything. "Mille" is Latin for thousand, which is the only reason the acronym isn't CPT. It measures reach pricing, not results: a low CPM means cheap eyeballs, not good ones.
Formula: CPM = (ad spend ÷ impressions) × 1,000
Example: You spend $100 and your ad gets shown 20,000 times. $100 ÷ 20,000 × 1,000 = a $5 CPM.
What counts as good: CPM swings too hard by niche for a single "good" number. Triple Whale's 2025 data across 30,000+ brands puts apparel around $10.93 and health and wellness around $19.30. Treat any CPM benchmark as directional — it's the most seasonal, auction-driven number in the account, and it swings with your niche, the time of year, and your audience. For the full breakdown of what drives Meta pricing, see how much Facebook ads really cost in 2026.
Beginners misread a rising CPM as the algorithm punishing them. It usually isn't — CPM is mostly auction demand you don't control, and a high CPM is fine if the ad still converts. Another trap: confusing CPM (per 1,000 impressions) with CPC (per click). They're not the same number.
CPC — Cost per click
CPC is what you pay each time someone clicks your ad — not just sees it. It's the first metric that ties spend to an action instead of a view, which is why beginners reach for it early.
Formula: CPC = ad spend ÷ clicks
Example: You spend $50 and get 100 clicks. $50 ÷ 100 = a $0.50 CPC. (Cheaper clicks come from one of two things: a cheaper CPM or a higher CTR.)
What's a good CPC?
On Google Search, clicks average around $2.69, with Google Shopping far lower at roughly $0.66 — long-run directional averages, not current-year measurements. Clicks on high-intent search cost more than a social feed because buyer intent is higher: someone typing a query is closer to buying than someone scrolling. A "good" CPC on Search would be a catastrophe on Shopping, so always compare like with like.
Beginners most often drive CPC down for its own sake. A $3 click that buys beats a $0.30 click that bounces. CPC is an input to your cost per sale, not a goal to minimize.
CTR — Click-through rate
CTR is the percentage of people who saw your ad and clicked it. Of every metric here, it's the clearest read on whether the creative itself is working, because it isolates one question: did the ad earn the click?
Formula: CTR = (clicks ÷ impressions) × 100
Example: 200 clicks on 20,000 impressions. 200 ÷ 20,000 × 100 = a 1% CTR.
What counts as good: Never quote one CTR across platforms — they're different universes, so judge yours against its own placement.
What's a good CTR?
Across paid advertising channels, the median CTR runs about 1.77% across 30,000+ brands, so at or above that is a healthy in-feed read. High-intent placements like Google Search run much higher than a scroll feed, because someone typing a query is closer to buying. Below roughly 1% on a social feed usually means the creative isn't stopping the scroll.
Watch out: reading a low CTR as a targeting problem. In 2026 the platform owns targeting — the automated campaign types most beginners are already running — Meta's Advantage+ and Google's Performance Max — pick the audience for you. So a low CTR almost always means weak creative, not a bad audience, and the creative is the one lever you fully control. Fastest fix: more shots on goal — pull a proven layout from 14,000+ ad examples and test variations until the CTR climbs.
ROAS — Return on ad spend (e-commerce)
ROAS answers the question every store owner cares about: for every $1 you put into ads, how many dollars came back as revenue? It's written as a ratio or a multiplier — 3:1, or 3x.
Formula: ROAS = revenue from ads ÷ ad spend
Example: $4,000 in revenue on $1,000 of ad spend. $4,000 ÷ $1,000 = a 4x ROAS.
What counts as good: Not the number you've heard. No universal "good ROAS" exists — the only honest benchmark is above your break-even ROAS, and that's set by your margin, not by an industry average.
What's a good ROAS?
Start with gross margin: the slice of each sale you keep after the cost of the product itself — sell a $40 item that cost you $24 and you keep $16, a 40% margin. Your break-even ROAS = 1 ÷ gross margin. That single line of math beats any folk number:
| Gross margin | Break-even ROAS | Read |
|---|---|---|
| 60% | 1.67x | Anything above 1.67x profits |
| 40% | 2.5x | 2.5x is exactly break-even |
| 25% (thin dropshipping margin) | 4x | You need 4x just to stop losing money |
These are rules of thumb, not benchmarks — your break-even above is the real test:
| Your ROAS | What it usually means |
|---|---|
| Under 2x | Losing money unless your margin is very high |
| 2–3x | Break-even to thin profit for most stores |
| 3–4x | Healthy for standard e-commerce margins |
| 4–6x | Strong — room to scale spend |
| 6x+ | Great per dollar, but often a sign you're underspending |
So a 2.1x ROAS quietly loses money at a 25% margin, while a 1.8x clears profit at a 60% margin. Where this goes wrong: treating 3:1 (or any single number) as the bar. A second trap: trusting in-platform ROAS — Meta and Google each over-claim credit for the same sale — over blended ROAS, which is total revenue ÷ total ad spend across everything.
AOV — Average order value (e-commerce)
AOV is the average dollar amount a customer spends per order. It's the quiet lever that fixes a "bad" ROAS without touching the ad at all.
Formula: AOV = total revenue ÷ number of orders
Example: $7,400 in revenue across 100 orders. $7,400 ÷ 100 = a $74 AOV.
What counts as good: AOV depends on your catalog. Across paid e-commerce channels the median order sits near $74, while Shopify cites a global average around $145. Lower-priced catalogs often convert better — less friction per order — so a low AOV isn't automatically a problem.
Watch out: AOV is a lever, not just a readout. Raise it with bundles, a free-shipping threshold, or order bumps (a small add-on offered at checkout), and your break-even ROAS drops — because more revenue per order means each ad dollar has more to work with.

Create your own static product ads
Create your adCPA — Cost per acquisition (e-commerce)
CPA is what it costs to get one outcome you actually care about — a purchase, a lead, or a signup. Where CPC counts clicks, CPA counts the thing that pays you.
Formula: CPA = ad spend ÷ conversions
Example: $500 in spend producing 20 sales. $500 ÷ 20 = a $25 CPA.
What counts as good: Meta's median e-commerce CPA runs around $38.19, while Google e-commerce search CPA sits near $45.27 and Shopping near $38.87 — long-run directional averages, not current-year measurements. But the benchmark only means something next to your own numbers.
Beginners judge CPA in a vacuum. A $40 CPA is excellent at a $120 AOV with repeat orders, and a $15 CPA loses money if the product nets $10. CPA is only readable alongside AOV and margin.
CPI — Cost per install (mobile app)
CPI is the app world's cousin of CPA: what you pay for one app install. If you run install campaigns, it's the number you'll stare at first — and the one most likely to mislead you.
Formula: CPI = ad spend ÷ installs
Example: $200 in spend producing 100 installs. $200 ÷ 100 = a $2 CPI.
What counts as good: Roughly $1.20 on Android versus $3.60 on iOS — iOS running about 3× Android. Platform split is the durable lesson — iOS runs roughly 3× Android — not the exact decimal, which shifts every quarter. App creative testing follows the same volume logic as e-commerce, and static ads can out-test video for cheap iteration.
One disambiguation worth keeping: CPI also means "Consumer Price Index," the inflation measure. Not this.
Beginners most often treat CPI as the success metric. AppsFlyer itself notes an install is no guarantee of engagement — a $0.80 install from users who never open the app loses to a $4.50 install from a payer. CPI is meaningless without LTV and retention sitting next to it.
LTV — Lifetime value (mobile app and e-commerce)
LTV is the total profit a customer is worth across their entire relationship with you — not just their first order or first session. It's the metric that tells you how much you can afford to pay to acquire someone.
Formula: LTV = AOV × purchase frequency × lifespan × gross margin (for apps and subscriptions: ARPU (average revenue per user) × average customer lifetime)
Example: A $74 AOV, bought 3 times a year, for 2 years, at a 50% margin = $74 × 3 × 2 × 0.5 = $222 in lifetime profit per customer.
What counts as good: LTV is too business-specific for a single dollar benchmark, so you judge it as a ratio against what acquisition costs. Your yardstick is the LTV:CAC ratio — general guidance, not hard cutoffs:
| LTV:CAC | What it means |
|---|---|
| Below 2:1 | Near break-even — acquisition is eating the customer's value |
| ~3:1 | Healthy for most businesses (e-commerce often lands 2:1 to 4:1) |
| 8:1+ | Usually a sign you're underspending |
CAC, or customer acquisition cost, counts every dollar spent winning a customer — ads, tools, discounts, team — not just ad spend. That's what makes it broader than CPA, which is usually just ad spend ÷ conversions.
Biggest beginner trap: training the whole account on first-purchase revenue. If customers reorder, you can profitably pay more than first-order value to acquire them — ignore LTV and you under-spend, capping your own growth. On the app side, the same blindness mis-reads a high CPI as failure when those users are the profitable ones. A cheap install is worthless if the user churns on day one, so CPI tells you what the door cost while LTV tells you whether anything was behind it.
How these metrics connect (the money funnel)
None of these eight numbers lives alone. They're one chain, and money leaks at whichever link is weakest.
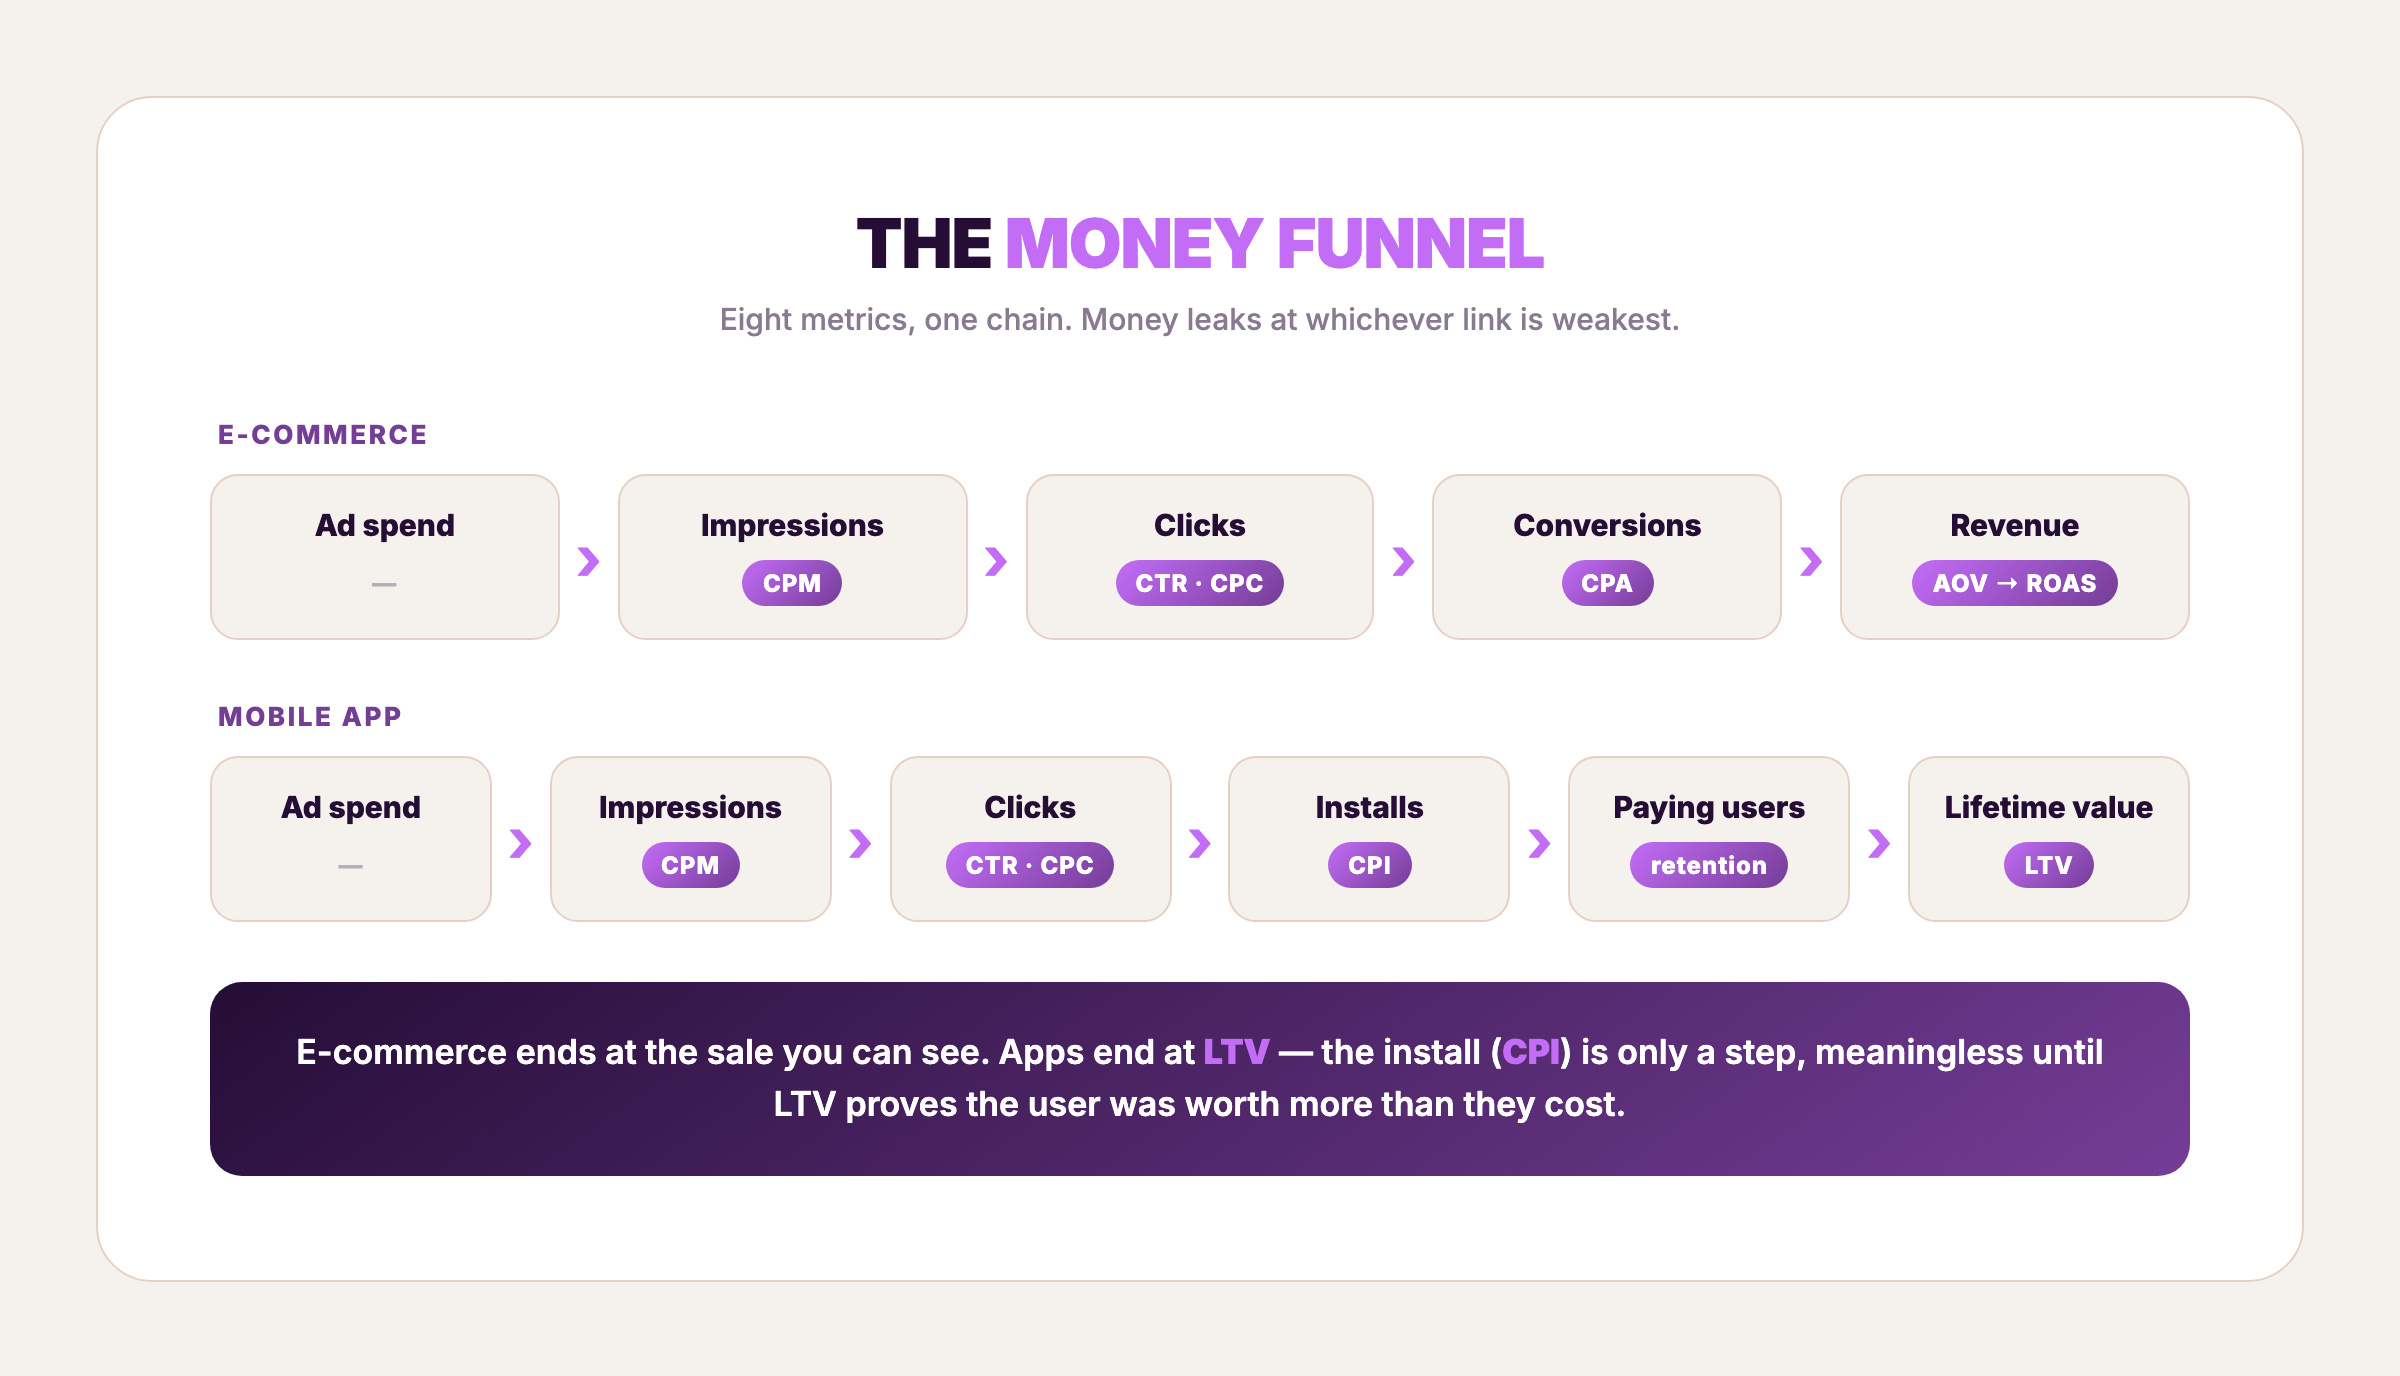
E-commerce chain: Ad spend buys impressions (priced by CPM). Impressions × CTR = clicks (priced by CPC). Clicks × conversion rate = sales (cost = CPA). Sales × AOV = revenue. Revenue ÷ spend = ROAS, which you judge against your break-even ROAS (1 ÷ margin) and, over time, against an LTV:CAC of at least 3:1.
Mobile-app chain: Spend → impressions (CPM) → clicks (CTR/CPC) → installs (cost = CPI) → activated and paying users (retention) → LTV. Then LTV ÷ CPI tells you whether the install was worth more than it cost.
One line worth remembering: in e-commerce, the sale is the goal and you can see it; in apps, the install is only a step — CPI alone is meaningless until LTV tells you the user was worth more than the install cost.
Which three metrics a beginner should watch
Eight metrics is the map. You don't drive looking at all of them. Start with three:
- CTR — your fastest read on whether the creative works. It moves first and tells you whether to keep iterating on the ad.
- CPA (e-commerce) or CPI against LTV (apps) — your real cost per result, the number that decides if the campaign pays.
- ROAS against break-even (e-commerce) or LTV:CAC (apps) — the profit verdict. Everything else is diagnostic.
Watch those three daily and the other five become tools you reach for when one of them breaks. And since creative is the variable you own, the fastest way to move a stuck CTR is to test more of it — clone a proven ad and swap in your product, or compare the tools that do it, then let the numbers above tell you which version won.
Related terms in 30 seconds
A few neighbors you'll bump into, defined fast so they don't derail the eight that matter:
- Impressions — how many times your ad was shown (the same person can count more than once).
- Reach — how many unique people saw it.
- Frequency — impressions ÷ reach; how many times the average person saw your ad.
- CVR (conversion rate) — the share of clickers who converted: conversions ÷ clicks.
- ARPU — average revenue per user; the per-user revenue figure that feeds the app-side LTV formula.
- CAC — customer acquisition cost; counts every dollar spent winning a customer, which makes it broader than CPA.
- ROI vs ROAS — ROAS is revenue per ad dollar; ROI is profit per dollar after costs. A 3x ROAS can be a losing ROI.
FAQ
What does CPM stand for?
CPM stands for cost per mille — "mille" being Latin for thousand — so it's the cost to show your ad 1,000 times. It measures the price of reach, not clicks or sales. A $20 CPM means 1,000 impressions cost you $20.
What does $15 CPM mean?
A $15 CPM means you pay $15 every time your ad is shown 1,000 times. Spend $150 at a $15 CPM and you'll get roughly 10,000 impressions. It says nothing about how many of those people clicked or bought — that's CTR and CPA.
Is a 2.5 ROAS good?
A 2.5x ROAS is good only if it clears your break-even ROAS, which is 1 ÷ your gross margin. At a 40% margin, break-even is exactly 2.5x — so 2.5 earns zero profit. At a 60% margin it's profitable; at a 25% margin (break-even 4x) it loses money.
Is a ROAS of 10 good?
A 10x ROAS is almost always profitable, but it often signals you're underspending. A return that high usually means you're only capturing the cheapest, most ready-to-buy customers — scaling spend and accepting a lower (but still above break-even) ROAS frequently produces more total profit.
What's the difference between ROAS and ROI?
ROAS measures revenue per ad dollar; ROI measures profit per dollar after costs. ROAS = revenue ÷ ad spend, while ROI = (revenue − total cost) ÷ total cost. A 3x ROAS can still be a negative ROI once product cost, shipping, and fees come out — ROAS ignores margin, ROI doesn't.
What is a good CTR on Facebook ads?
Facebook-feed CTR varies, but across paid advertising channels the median runs about 1.77%, so treat at or above that as healthy in-feed. Below roughly 1% usually means the creative isn't stopping the scroll — and because the algorithm owns targeting, that's a creative problem, not an audience one.
CPI vs LTV — which matters more for app ads?
LTV matters more. CPI tells you what an install costs; LTV tells you what that user is worth over time. A $0.80 install from someone who never opens the app loses to a $4.50 install who becomes a payer, so CPI is only meaningful when judged against LTV.


